
Design Storm Duration vs Return Period in Ontario
Design storm duration vs return period separates the rainfall time window from the rarity of a specified magnitude. Neither defines the entire event. This Ontario guide explains stormwater IDF curves, Chicago vs SCS storms and stormwater rainfall distribution. Use these distinctions to read a drainage report and ask the engineer about the complete event definition, governing criteria and limits of the assessment.
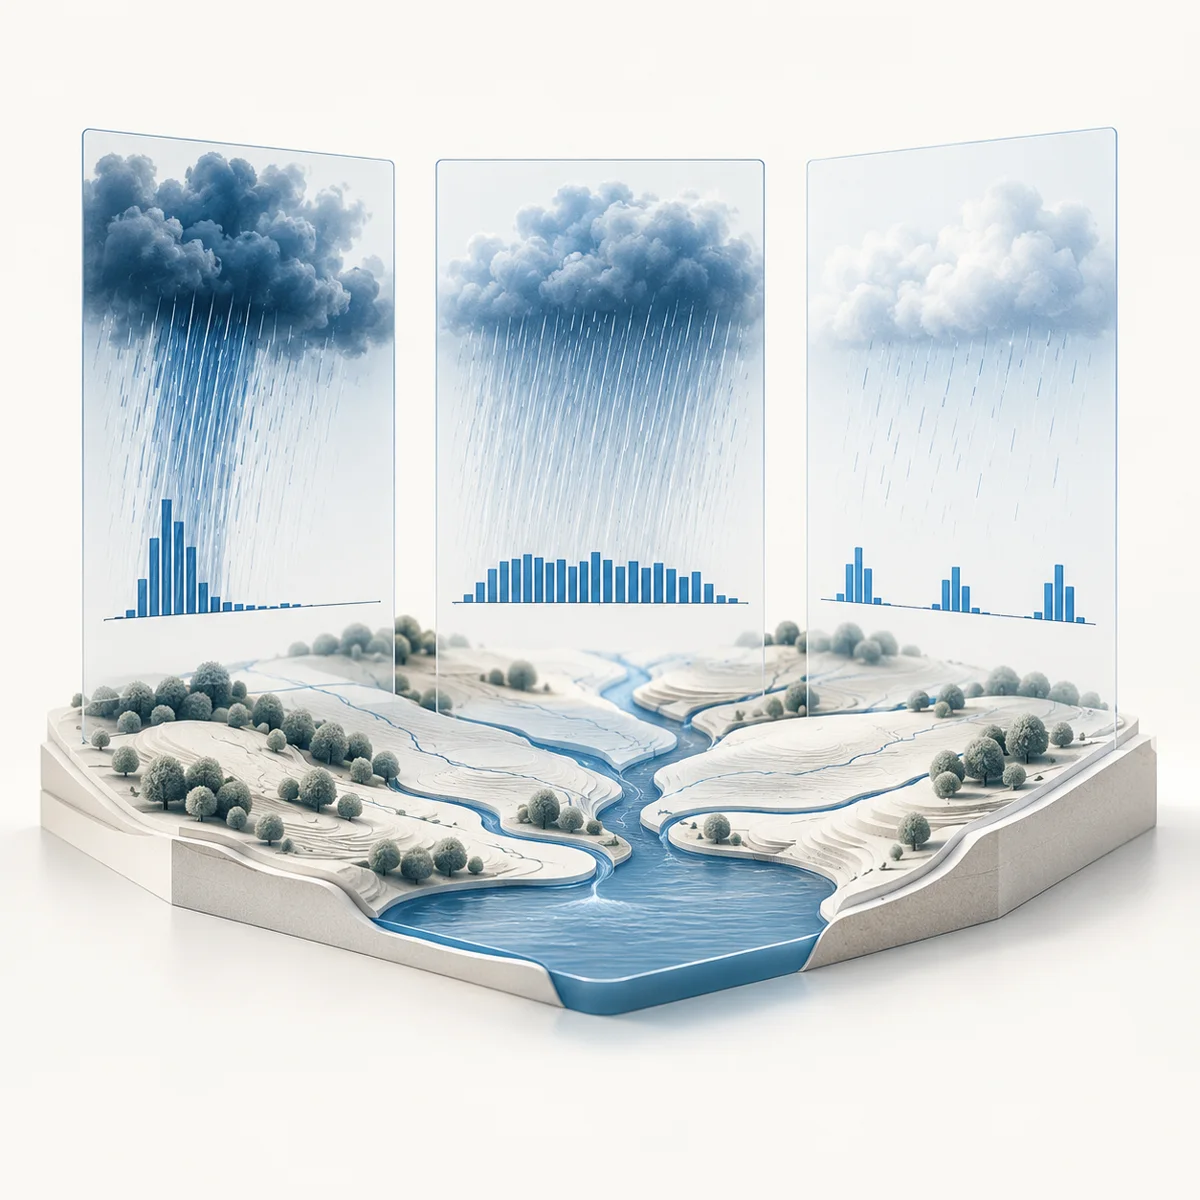
Design storm duration vs return period: two different questions
Design storm duration vs return period is a distinction between a time window and a statistical frequency. Duration describes how long the assessed rainfall lasts. Return period describes the rarity assigned to a rainfall magnitude for a specified duration and location. Neither term, by itself, tells you how rainfall is distributed within the event.
For an owner reading a stormwater report, that distinction changes the questions worth asking. A table headed “100-year storm” is incomplete if the reader cannot find the duration, rainfall source and distribution used. Conversely, a label such as “four-hour event” does not identify its frequency. A useful event description brings these separate choices together.
This guide concerns interpretation of design assumptions. It does not choose a design storm for your property or provide an independent model certification. The project engineer must establish the applicable criteria and explain the assessment in the context of the site. Start with the decision the report supports, rather than selecting a familiar storm label.
Keep the rainfall input separate from the design result
The rainfall event is an input. Predicted runoff, water levels and required storage are outputs from an analysis with additional assumptions. Therefore, an event name alone cannot demonstrate that a proposed outlet, pipe or storage feature works.
Also separate the design result from acceptance. A calculation may be complete while a required review remains outstanding. Keep the report issue date, drawing revision and approval correspondence with the event information so those different states remain visible.
- Source: which rainfall information and version?
- Frequency: which return period or probability basis?
- Duration: which rainfall time window?
- Distribution: how is rain arranged within that window?
These fields describe the rainfall input. They are not a calculated drainage result or a universal Ontario design requirement.
Read design storm duration and rainfall units
Rainfall depth describes an accumulated amount, commonly expressed in millimetres. Intensity describes an average rate over a stated interval, commonly millimetres per hour. Duration identifies that interval. Read the unit and time window together before comparing figures from different reports.
For example, a depth and a rate are not competing estimates of the same quantity. One describes an amount; the other describes how quickly that amount arrives over a selected period. A report using stormwater IDF curves should make this difference clear through column headings and units, not leave the owner to infer it from a large number.
Suppose a purely arithmetic illustration spreads 12 millimetres evenly across one hour. Its average intensity is 12 millimetres per hour. Spreading the same illustrative depth evenly across two hours gives an average of 6 millimetres per hour. These invented values explain units only. They are not observed rainfall, design criteria or a model of either storm’s internal peak.
An average is not every moment
Actual rainfall can vary within the time window. Consequently, the average intensity over a whole event need not equal the highest intensity over a shorter interval. Avoid replacing a detailed rainfall series with one average unless the selected engineering method legitimately calls for it.
When a summary uses both depth and intensity, ask whether they refer to the same duration and source. If not, label the difference. This simple document check can prevent an otherwise tidy comparison from mixing unlike rainfall inputs.
What a return period does—and does not—say
When comparing design storm duration vs return period, remember that a return-period label is not a schedule. It does not promise that a large rainfall event happens once and then stays away for the stated number of years. In the conventional annual-probability interpretation, a 100-year level corresponds to a one-percent annual exceedance probability under the statistical assumptions used. It does not create a 99-year period of protection after an event.
ClimateData.ca’s IDF explanation describes return periods as rainfall probabilities, rather than regular recurrence dates. It also distinguishes rainfall information at a measurement location from conditions over a wider area. That makes the location and duration part of the meaning, not optional footnotes.
Owners should avoid transferring a rainfall return period directly to every possible consequence. A statement about rainfall rarity is not automatically a statement about the probability of basement flooding, road closure or failure of a particular component. Those outcomes depend on the drainage system and the conditions represented.
Ask what the label belongs to
On a results sheet, find out whether the frequency label describes rainfall, a flow estimate, a water level or another quantity. If an explanation moves between those quantities, ask the engineer to identify the connection. Similar terminology does not make them interchangeable.
Keep this question practical: “Which event was assessed, and which performance measure does this result describe?” It invites a clear engineering explanation without asking the owner to recreate the statistical analysis.
Stormwater IDF curves: read the source before the number
Stormwater IDF curves relate intensity, duration and frequency. They help identify a rainfall intensity associated with a selected duration and return period. However, the curve is not a complete sequence of rainfall through time. A model may need a separate temporal distribution to turn the selected rainfall information into an event input.
Environment and Climate Change Canada’s Engineering Climate Datasets page provides IDF tables, graphs and supporting documentation, with current and historical versions available. This is useful source information. It does not, by itself, establish which dataset or formula the municipality accepts for a particular submission.
Request the station or dataset identifier, publication or update information, and the source used by the engineer. A copied chart without that context is difficult to trace. Likewise, a filename containing “latest” is not a dependable version record.
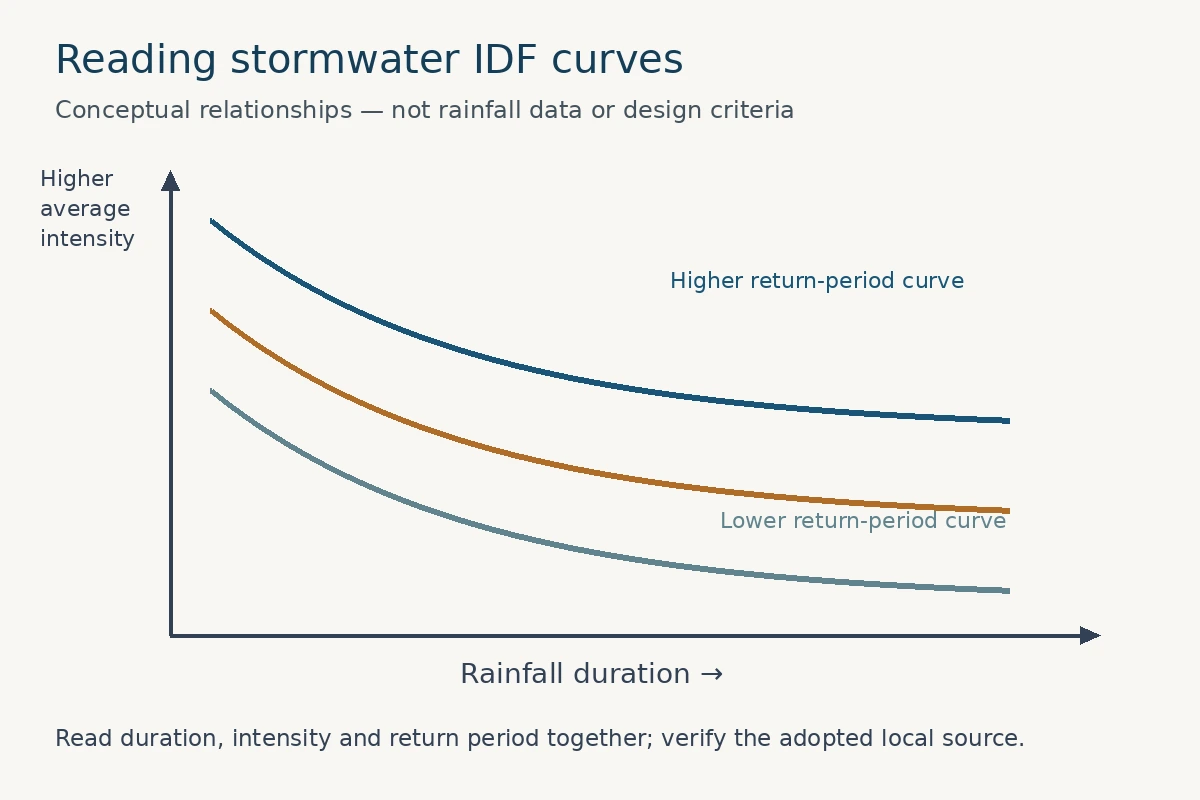
Preserve the adopted IDF basis
Keep the actual stormwater IDF curves and their source reference with the issued report. If a municipal formula is used, identify its applicable document and version. If the engineer adopts another accepted approach, ask for its basis and any required confirmation.
Do not replace the adopted data with a nearby station merely because it is easy to download. Suitability is an engineering and review question. When an update becomes available during design, flag it for assessment rather than silently combining old and new values in the same package.
Stormwater rainfall distribution: the shape matters
Stormwater rainfall distribution describes how the rain is arranged through the event. A hyetograph displays rainfall intensity or depth increments against time. A hydrograph instead describes flow against time. Distinguishing these two plots helps an owner separate the storm input from the catchment’s response.
Two conceptual events can have the same total depth and duration but a different stormwater rainfall distribution. One might concentrate rainfall near the beginning; another might place more rainfall later. The figures describe different sequences, even though the totals match.
That observation is not a prediction that one sequence always causes a larger peak or needs more storage. The response depends on the site, drainage arrangement and model assumptions. Therefore, an engineer selects and evaluates the required distributions rather than deciding from a graphic alone.
Read storm duration on the time axis
Check whether a plot shows minutes or hours and whether the vertical axis shows an intensity or a depth increment. Also check the interval used to describe the rainfall. A smooth-looking chart and a stepped chart can reflect different plotting choices rather than a meaningful design difference.
If a comparison combines different time scales, ask for a consistent presentation or a clear note. The owner should be able to identify the difference being discussed without mistaking a changed chart scale for changed engineering performance.
| Label | Question it answers | What remains to establish |
|---|---|---|
| Return period | How rare is the specified rainfall magnitude? | Duration, source and distribution |
| Duration | Over what rainfall time window? | Frequency and internal timing |
| Distribution | How is rainfall arranged through time? | Applicable depth and design basis |
| Model result | What response was calculated? | Inputs, limitations and acceptance status |
Chicago vs SCS storms: identify the exact definition
Chicago and SCS names identify different ways of representing a design storm’s temporal pattern. They do not replace the need to state the duration, frequency and rainfall basis. A note saying only “Chicago” or “SCS” leaves important information unresolved.
The Lake Simcoe Region Conservation Authority’s January 2026 submission guidelines, Appendix C, discuss Chicago and SCS Type II distributions with different durations. The appendix also directs proponents to municipal requirements for current IDF information. This is watershed-specific submission guidance, not a universal Ontario storm schedule.
When comparing Chicago vs SCS storms, ask the engineer to show which complete event definitions were used and why. Comparing the names alone cannot explain the design decision. Similarly, importing an event from a neighbouring project’s model does not establish that it applies to the new proposal.
Chicago vs SCS storms: record the full event settings
A comparison of Chicago vs SCS storms should be traceable to the report’s complete event descriptions, not just the selected model options. Where a distribution has configurable parameters, the issued input record should identify the relevant settings. Keep a clear distinction between an accepted modelling convention and a default that happened to be selected.
If an earlier file and a current report describe different storms, resolve the discrepancy before interpreting the results. An owner can ask which file belongs to the issued package without attempting to modify the model personally.
Choose the assessment question before comparing storms
Design storm duration vs return period becomes most useful when tied to a specific question. Is the assessment examining a discharge peak, available storage, a surface route or another performance objective? Different questions can need different evidence, so a single result should not silently stand for the whole drainage strategy.
For example, a peak-flow table tells a different story from a storage-level summary. Both may be necessary within a project, but neither replaces an explanation of what was checked. Ask for each result’s location, scenario and applicable criterion.
ClimateData.ca’s IDF best-practice guidance emphasizes selecting durations and return periods suited to the application. For a development submission, that principle works alongside the current criteria and directions of the reviewing authorities. It is not an invitation to choose an easier event because another event produces an inconvenient result.
Separate an event test from a complete design conclusion
A successful result for one assessment does not prove that every required check has passed. Ask the report to identify the event set and the purpose of each run. Where a required assessment is absent, identify the outstanding work rather than filling the gap with a broad reassurance.
Also distinguish event-based calculations from a longer-term water-balance assessment. A single event plot is not a substitute for the different inputs and methods needed to answer a continuous or seasonal question.
Which design storm duration governs a result?
“Critical duration” should identify the duration that governs a stated assessment within the cases considered. It is not a free-standing property of every Ontario site. When the phrase appears in a report, ask what result it governs and which event set was examined.
Keep the comparison transparent. A table should show the relevant events and results rather than only one preferred line. The engineer can then explain the governing case and any separate cases that control other parts of the design.
Do not assume the shortest event is always most important because its rainfall rate seems high. Likewise, the longest event is not automatically decisive because it lasts longer. The design question and the system response determine the useful comparison.
Record which storm duration supports the conclusion
A conclusion about the proposed storage feature should not silently become a conclusion about every downstream condition. Label the assessment point and the component concerned. If two components have different governing cases, keep both findings visible.
This approach also helps when the layout changes. A revised outlet or drainage route may require reconsidering which case controls. The old conclusion should not remain attached to a new design without engineering assessment.
Keep design storm duration separate from travel time
The design storm duration vs return period distinction also helps separate rainfall inputs from catchment timing. Catchment travel-time assumptions describe movement through the drainage area. They are related in engineering methods, but they are not interchangeable labels. A report should explain the selected method and its relevant timing inputs clearly.
For an owner, the useful check is whether the drainage route shown on the drawings matches the route described in the calculations. A revised downspout connection, paved area or collection point can affect that relationship. Tell the engineer when those features change.
Do not adjust a model timing value to make the result resemble an earlier report. Instead, ask how the current layout supports the selected input. The explanation should connect to the project’s actual evidence and adopted method.
Distinguish storm duration from model time steps
A rainfall input interval describes how the event data is represented. A computational time step describes how an analysis advances. Depending on the method, they may differ. Neither is the same as total event duration.
The engineer should select and document appropriate settings. The owner need not prescribe those settings, but can ask whether the submitted files reproduce the issued report and whether significant limitations are disclosed. A screenshot of one settings panel is not a substitute for a coherent calculation record.
Design storm duration under local criteria
Begin with the authority and application process for the actual property. A municipal standard, watershed study, master drainage plan or project-specific direction may affect the design basis. Identify those sources before comparing a new report with an older accepted example.
The current LSRCA policies and guidelines page links to its stormwater submission guidance. Checking the current index matters: an older PDF can remain available at a familiar address after a newer edition appears. Record both the document date and the access date in the project file.
An authority-specific requirement should stay within its stated scope. Do not treat a railway asset standard, one watershed’s appendix or a neighbouring municipality’s checklist as a province-wide rule. Where sources appear inconsistent, the project team should obtain clarification through the appropriate review channel.
Keep confirmed and pending requirements separate
A criteria schedule can distinguish a confirmed instruction from an assumption awaiting review. That makes the remaining decision explicit. Otherwise, an unconfirmed interpretation can become embedded in several drawings before anyone notices the uncertainty.
Keep written clarification with the report record and identify the affected issue. A new source version does not automatically invalidate every earlier design, but it does warrant a documented applicability decision by the responsible team.
Climate assumptions need their own clear record
A future-climate assessment adds assumptions that should be stated separately from the historical rainfall source. Avoid a vague label such as “climate adjusted” without an explanation of what changed and why it applies.
Ask the engineer to identify the adopted climate information, assessment horizon and adjustment method where relevant. Also ask which authority requirement or accepted project basis supports the approach. The owner should not choose a universal percentage from an unrelated online example.
Keep historical and adjusted scenarios clearly labelled. If a comparison changes both the rainfall basis and the site layout, it becomes harder to identify why a result changed. A transparent scenario schedule makes those differences visible.
Do not conceal uncertainty with a precise number
A value printed to several decimal places can still rely on uncertain assumptions. The report should identify material limitations and explain how they affect the design decision. Numerical precision is not the same as evidence quality.
Where additional assessment remains necessary, describe the question and responsibility for resolving it. This gives the owner a usable next step without pretending that an uncertainty note is an approval or a guarantee.
Requirement → source and version → adopted input → assessed scenario → reported result → coordinated drawing.
Each arrow is a document connection to verify. The sequence does not imply that every project requires the same analysis.
A report checklist for design storm duration
Ask for a readable account of the event assumptions alongside the technical submission. The aim is not to duplicate the engineer’s calculations. It is to preserve enough context that the owner and future project team can understand which proposal was assessed.
- The rainfall source, identifier and version used.
- The complete event names, including frequency, duration and distribution.
- The purpose and assessment point for each reported result.
- The site-layout and drainage-area revisions used in the analysis.
- The relevant criteria, outstanding assumptions and review status.
- The issued report and associated model or calculation deliverables within the agreed scope.
Keep filenames and revision dates consistent. If a report references a drawing that was superseded, ask whether the engineering assessment also needs revision. A document register is useful because it connects the report to the actual package rather than an informal folder of mixed issues.
Compare proposals by scope, not software names
Two engineering proposals can use similar terminology while covering different tasks. Ask whether the scope includes data review, runoff analysis, coordinated drawings and responses to review comments. Identify investigations or specialist assessments that need a separate assignment.
Likewise, an existing model file does not establish the scope required to reuse it. Its purpose, input quality and connection to the current proposal need assessment. Describe the decision you need help with before asking for a price or completion date.
A fair comparison of design storm duration assumptions
For a clear design storm duration vs return period comparison, keep a short change record alongside the results. Identify what changed between the cases and what stayed fixed. Otherwise, a lower discharge figure can appear to be an improvement when it actually reflects a different rainfall input or assessment point.
Start with the question being tested. If the team is comparing two drainage layouts, the report should explain the common design basis and any justified differences. If the team is examining alternative rainfall assumptions, identify that purpose instead. Those are different comparisons and should not share an ambiguous heading.
Then check the location of the reported result. A flow at one control’s outlet is not necessarily the total discharge from the property. Similarly, a water level inside a storage feature is not a finished-ground elevation. Ask the engineer to connect result labels to the drawing so that a comparison remains meaningful.
Track revisions without rewriting their history
Keep earlier issued documents identifiable, but make the current package unmistakable. A revision note can explain which assumptions were reconsidered and which drawings were affected. It should not imply that every unchanged section was newly assessed unless that was part of the work.
If an old report’s assumptions cannot be established, say so in the project discussion. The next step may be retrieving records or defining further analysis. It is not safe to infer an event distribution from a result that happens to resemble another project.
Questions that resolve an unclear rainfall summary
A productive question points to a specific gap. Instead of asking whether a report is “good enough,” identify the missing event description, source version or drawing reference. This allows the responsible engineer to explain the issue or define the additional work needed.
For example: “The summary lists a return period, but I cannot find the duration. Which event does this line represent?” Another useful question is: “The report refers to the previous roof layout. Has the changed roof drainage been assessed?” Both questions concern traceability rather than directing a technical answer.
Keep responses with the issued documents. If the explanation changes a design assumption, ask whether the report or drawings need a revised issue. An email clarification and an updated engineering package do not automatically serve the same purpose.
Plan the next decision, not an assumed approval date
The next milestone may be confirming criteria, obtaining missing site information or coordinating a revised layout. Ask which decision unlocks the next stage and who is responsible for it. This is more useful than assuming that a completed rainfall table means the whole submission can proceed.
Also distinguish the consultant’s preparation work from external review. The engineer can identify the assignment and document its progress; the reviewing authority controls its own assessment. Clear roles help keep a rainfall-input question from turning into an unsupported promise about acceptance or timing.
Conceptual examples: interpreting different event descriptions
Consider an owner checking design storm duration vs return period in two reports that both refer to a 100-year event. The first useful step is not to rank their storage figures. It is to compare the full rainfall definitions, assessed site conditions and performance objectives. Different durations or distributions may mean the figures answer different questions.
In a second conceptual situation, the site layout changes after the stormwater report is prepared. The rainfall source stays the same, but roof drainage now reaches a different control. The owner should notify the engineer and request assessment of the revised arrangement. An unchanged event label does not establish that the old result still describes the proposal.
These situations illustrate document-reading questions, not measured project results. They provide no storage recommendation, accepted storm schedule or prediction of flooding. The engineering task is to connect a supported rainfall basis to the actual drainage design.
Another project: coordinated civil design
In another project documented in its public portfolio, Elmid Design Inc. prepared stormwater and functional servicing reports with grading, servicing and erosion-control drawings for a proposed commercial office development. This is evidence of coordinated design work, not a claim about particular storm inputs, measured performance or a completed installation.
Elmid Design Inc. stormwater reporting support
Elmid Design Inc. prepares stormwater management reports and coordinated drainage design. Within an agreed assignment, the work can connect runoff analysis, storage and outlet design with grading and servicing drawings. Clear event descriptions help explain that design basis and the limitations of the assessment.
Provide the current site layout, available survey, earlier drainage reports and written municipal comments when requesting a proposal. The team can identify the required deliverables and missing inputs. This educational guide does not offer independent peer review, field testing or a guarantee of approval.
Frequently Asked Questions
Is storm duration the same as return period?
No. Duration is the rainfall time window; return period is a frequency measure associated with a specified rainfall magnitude. A complete event description needs both, together with its source and distribution.
Does a 100-year storm happen only once every century?
No. The label does not create a regular cycle or a waiting period after an event. Read the stated statistical basis and distinguish the rainfall probability from a particular property’s flooding risk.
Can I compare two reports using only their return periods?
No. Compare duration, rainfall source, distribution, scenarios and assessment objectives as well. Matching frequency labels do not establish that the calculations answer the same engineering question.
Does an IDF curve provide a complete storm sequence?
No. It relates intensity, duration and frequency. Where the analysis needs rainfall through time, the selected temporal distribution and associated parameters must also be established.
Chicago vs SCS storms: is either always correct in Ontario?
No single choice follows from the provincial location alone. Confirm the current applicable criteria and the complete event definitions with the project engineer. A named distribution is not a universal approval rule.
Can the longest storm duration automatically determine storage?
No. Ask which cases were assessed and which result governs the proposed system. Do not substitute a general assumption about duration for the required engineering comparison.
Can a rainfall label establish that my property will never flood?
No. A label describes an assessed input, not protection against every condition. Ask about the design basis, limitations, overflow strategy and responsibilities that apply to the actual property.
What should I do when the site plan changes?
Send the revised drawings to the responsible engineer before relying on earlier results. The team should determine whether the changed drainage arrangement affects the analysis and issued documents.
Geographic Locations That We Service:
Our Licensed Professional Engineers provide stormwater reporting and drainage design for Ontario projects, coordinated with site grading plans and erosion and sediment control plans where required by the agreed scope.
We provide engineering services across a wide range of municipalities, each with its own requirements and review processes.
Toronto and Surrounding Areas
We provide engineering services in Toronto and provide grading engineering resources through our Toronto grading plan page.
Our service area also includes Oshawa, Pickering with our Pickering grading plan resources, and Clarington.
We also provide engineering services in Ajax through our Ajax grading plan resources, Whitby, Brock, Scugog, and Uxbridge, including our Uxbridge grading plan resources.
Halton Region
Within Halton Region, we provide engineering services in Burlington, including projects requiring Burlington grading plans.
We also provide engineering services in Halton Hills, supported by our Halton Hills grading plan resources.
Our service area also includes Milton and Oakville, including our Oakville grading plan resources.
Peel Region
Within Peel Region, we provide engineering services in Brampton, including projects requiring Brampton grading plans.
We also provide engineering services in Mississauga through our Mississauga grading plan resources and Caledon through our Caledon grading plan resources.
York Region
Within York Region, we provide engineering services in Vaughan and provide information about Vaughan grading plans.
We also provide engineering services in Aurora through our Aurora grading plan resources and East Gwillimbury through our East Gwillimbury grading plan resources.
Additional service areas include Georgina with our Georgina grading plan resources, Markham with our Markham grading plan resources, and Newmarket with our Newmarket grading plan resources.
We also provide engineering services in Richmond Hill with our Richmond Hill grading plan resources, Whitchurch-Stouffville through our Whitchurch-Stouffville grading plan resources, and King through our King grading plan resources.
Our service area also includes Bradford West Gwillimbury.
Other Southern Ontario Cities and Towns
We provide engineering services in many additional Southern Ontario communities, including Hamilton, St. Catharines, Niagara-on-the-Lake, Brant, Cambridge, Kitchener, Waterloo, and Woodstock.
We also provide engineering services in Guelph, Centre Wellington, Shelburne, Orangeville, New Tecumseth, Essa, Collingwood, Wasaga Beach, and Barrie, including our Barrie grading plan resources.
Additional service areas include Midland, Orillia with our Orillia grading plan resources, Ramara, Minden Hills, North Kawartha, Kawartha Lakes, Peterborough, Selwyn, and Brighton.